Explanation for Variations in Charpy Impact Test Results
 Fabricators
often see significant differences in Charpy impact properties when
making procedure tests. This occurs even with the same welding
materials, plate and welding parameters. We encountered this situation a
number of years ago when exploring significant impact property differences
in multipass welds with process procedure variations that should not
have produced these differences.
Fabricators
often see significant differences in Charpy impact properties when
making procedure tests. This occurs even with the same welding
materials, plate and welding parameters. We encountered this situation a
number of years ago when exploring significant impact property differences
in multipass welds with process procedure variations that should not
have produced these differences.
When we
observed significant impact property variations where none should have
existed, we discussed this situation with Dr. Robert Stout from Lehigh
University who was a consultant to our Welding R&D Laboratory. We
employed his suggestion of comparing the impact results with the percent
refined versus unrefined weld metal in each Charpy specimen. This
approach mostly explained the differences at the higher test temperature.
But the procedure could not account for the difference of 44 ft-lbs to 8
ft-lbs found in the -50 degree F tests.
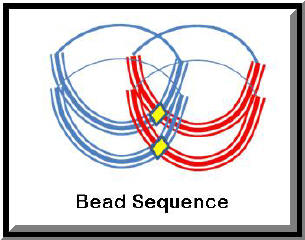
Our Senior Metallurgist,
Dr. E. C. (Ted) Nelson, postulated a possible reason for these differences
after examining the specimens.
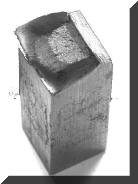
He requested we make a large multipass weldment so he could place Charpy
specimens avoiding any issues of plate dilution. Dr. Nelson carefully
located Charpy specimens in this weld and was able to duplicate the impact
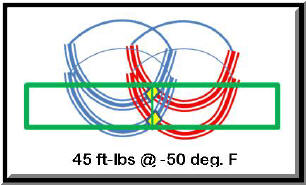
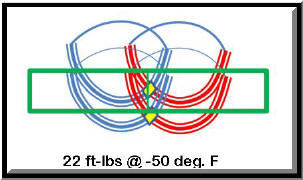
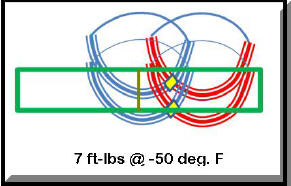
property range we had encountered. One Charpy producing 7 and
another 45 ft-lbs in the exact same weld metal! This web page
presents a
summary of the findings.